E
This is obviously late, by a few years. And, for all I know, duplicates something already here. In my defense, two years ago I did not know, or care, what a P1k was. On the bright side, this topic seems to bring out the best in people.
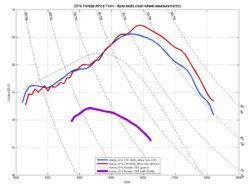
Cycle World (CW) magazine and Motorcycle.com (MCDC) published their dyno-test results of the Africa Twin (that’s a Honda motorcycle) when it came out for 2016. The engine has more than a just few similarities with the P1k powerplant, and probably with that of the Talon as well. I’ve not seen any dyno-test results for the 70-ish hp engines when put on four wheels, but here’s what the 90-ish hp version did on two wheels in the 2016 model year:
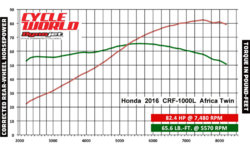
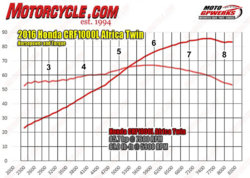
Horsepower here is rear-wheel horsepower, so engine horsepower is likely in the range of 95 +/-5.
The Africa Twin used dual throttle bodies and, I suspect, hotter cams, as opposed to the 2016 Pioneer version of the engine. I believe the Africa Twin started with 10:1 compression ratio in 2016, I’ve not seen what the Pioneer 1k squeezes.
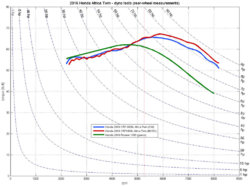
Knowing nothing else, I would expect the P1k engine to have similar or slightly higher torque below 4000 rpm, a torque peak with less amplitude and at a lower rpm, and if a single throttle body, expect a slightly steeper roll-off above 6000 rpm. So for kicks and giggles, and for lack of anything better, I threw in a hypothetical torque curve for the P1k in green in the plots below.
If anyone wanted a graphic example of the relationship between torque and power, you could plot the Africa Twin torque data from CW and MCDC, and then add iso-power lines, in this case, for American readers, constant-horsepower lines, and it would look like this:
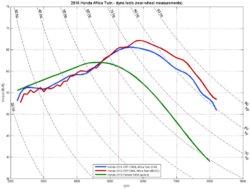
"Torque" in ft-lbs (or lb-ft) is the vertical axis and "rpm" is the horizontal axis. Iso-power (constant horsepower) is the almost-vertical gently curved lines.
The iso-power lines make a lot more sense if you generate the plot starting at zero for both axes:
where it's more obvious that, if you have zero torque, you have zero horsepower (regardless of rpm), and if you have zero rpm, you again have zero horsepower (regardless of torque). I haven’t had a chance lately to stare at the tachometer while running WOT (WOTB?), so the location (rpm) of the green peak could be off a bunch. And the same for the amplitude of the green peak, for that matter. Comments from left- and right-cheek accelerometers welcome, or from actual dyno data.
Cycle World (CW) magazine and Motorcycle.com (MCDC) published their dyno-test results of the Africa Twin (that’s a Honda motorcycle) when it came out for 2016. The engine has more than a just few similarities with the P1k powerplant, and probably with that of the Talon as well. I’ve not seen any dyno-test results for the 70-ish hp engines when put on four wheels, but here’s what the 90-ish hp version did on two wheels in the 2016 model year:


Horsepower here is rear-wheel horsepower, so engine horsepower is likely in the range of 95 +/-5.
The Africa Twin used dual throttle bodies and, I suspect, hotter cams, as opposed to the 2016 Pioneer version of the engine. I believe the Africa Twin started with 10:1 compression ratio in 2016, I’ve not seen what the Pioneer 1k squeezes.
Knowing nothing else, I would expect the P1k engine to have similar or slightly higher torque below 4000 rpm, a torque peak with less amplitude and at a lower rpm, and if a single throttle body, expect a slightly steeper roll-off above 6000 rpm. So for kicks and giggles, and for lack of anything better, I threw in a hypothetical torque curve for the P1k in green in the plots below.
If anyone wanted a graphic example of the relationship between torque and power, you could plot the Africa Twin torque data from CW and MCDC, and then add iso-power lines, in this case, for American readers, constant-horsepower lines, and it would look like this:

"Torque" in ft-lbs (or lb-ft) is the vertical axis and "rpm" is the horizontal axis. Iso-power (constant horsepower) is the almost-vertical gently curved lines.
The iso-power lines make a lot more sense if you generate the plot starting at zero for both axes:

where it's more obvious that, if you have zero torque, you have zero horsepower (regardless of rpm), and if you have zero rpm, you again have zero horsepower (regardless of torque). I haven’t had a chance lately to stare at the tachometer while running WOT (WOTB?), so the location (rpm) of the green peak could be off a bunch. And the same for the amplitude of the green peak, for that matter. Comments from left- and right-cheek accelerometers welcome, or from actual dyno data.


